Data Analyst · Analytics Engineer

Harsh Patel

Open to Data Analyst & Analytics Engineer roles in Canada
Beans Raw data
Grind Clean & prep
Brew Model & logic
Serve Decision view
SQL & Data Modeling
ETL Pipeline Architecture
Decision-Ready Dashboards
Data Quality Engineering

Where I've been doing the work

Centauri AI Market Research Analyst · Contract

Early-stage AI startup building computer vision and document intelligence for construction. I supported the founding team with competitive research and go-to-market analysis.

Present · 2026
Competitive landscape — 20+ construction tech players in one place

The founding team was making product and go-to-market calls based on scattered notes, half-finished spreadsheets, and whatever someone remembered from a demo last week. No shared view of who was doing what.

Pulled together a structured competitive view of 20+ construction tech companies, tracking pricing, product features, positioning, and recent moves like funding or acquisitions. Pulled signals from company websites, review sites, and public sources, and organized everything into a consistent shape so competitors could actually be compared side by side.

Impact

Gave the founding team a clear picture of the market they were walking into, which made product and positioning conversations less opinion-driven and more grounded in what was actually out there.

Market Research LLM Workflows Excel Notion
LLM-assisted research workflows — faster scans, consistent output

Manually reading through dozens of competitor sites and pricing pages was eating most of the week, and different research rounds kept producing slightly different shapes of data.

Designed prompt-based research workflows that used LLMs to extract structured info from messy web sources: pricing, feature lists, target customers, and positioning language. Standardized the output format so each competitor scan slotted into the same template, and documented the prompts so the process stayed repeatable instead of one-off.

Impact

Cut down manual research time on each competitor and made outputs consistent enough that the team could trust comparisons without double-checking the source every time.

Prompt Design LLMs Python Excel
Vertical prioritization & BI dashboard — where to actually sell first

As a small team, "go after everyone in construction" was not a strategy. The founders needed a defensible way to pick which segments to chase first without relying on gut feel alone.

Scored prospect segments across company size, tech maturity, and pain severity to surface 3 priority verticals for early outbound. Then built a Power BI market intelligence dashboard that brought competitor feature releases, pricing shifts, and acquisition activity into one place, so competitive monitoring stopped being a weekly scramble.

Impact

Gave the founding team a concrete starting point for outbound sales and a single view of the competitive landscape, replacing ad hoc research with a decision-ready layer.

Power BI DAX Segmentation Go-to-Market
Alberta Innovates Data & Reporting Analyst · Contract

Provincial innovation agency funding Alberta's tech ecosystem. I worked with the data team on corporate planning and leadership reporting.

8 months · 2025
Post-investment metrics — getting to one place for the truth

Grant performance data over 8+ years lived in different spreadsheets and trackers. Every big review started with "which version of this is right?"

Helped build a reusable reporting model in Microsoft Fabric and Power BI so leaders could pull numbers from one place instead of chasing files. I worked on loading and cleaning historical spreadsheets, shaping them into a simple star schema for programs and projects, and running reconciliation checks so the new numbers matched what finance expected. I also documented how key metrics were calculated so different teams stopped maintaining their own formulas.

Impact

Made executive reports easier to trust: one source of metrics, fewer last-minute fixes, and clearer answers when someone asked, "where did this number come from?"

Microsoft Fabric Power BI SQL Excel
Alberta tech landscape — research pack for strategy conversations

Leadership wanted a clearer, data-backed picture of Alberta's tech ecosystem to guide program focus, but information lived across reports, websites, and one-off discussions.

Pulled together public datasets, internal notes, and stakeholder input into a structured view of sectors, stages, regions, and funding gaps. Built summary tables and simple visuals that could drop into slide decks and briefings, and kept a small "sources & assumptions" log so people knew what the numbers actually represented.

Impact

Gave leaders a concrete starting point for program discussions and made it easier to explain the province's tech story to government partners.

Python Excel Power BI SharePoint
Funding dashboards & refreshes — monthly reports without the scramble

Monthly funding summaries were built by copying numbers between spreadsheets. Any last-minute question meant starting another manual version.

Helped design a Power BI model on top of Fabric dataflows so core funding KPIs were always available in one dashboard. I contributed queries for program and project views, set up scheduled refreshes, and added simple validation checks so we could spot issues before meetings. For a few recurring asks, I used Python to tidy raw extracts into shapes the model could consume.

Impact

Shifted monthly reviews from "build the pack" to "open the dashboard," and cut down the time spent rebuilding the same views every cycle.

Power BI Microsoft Fabric Python SQL DAX
Whistling Solutions Data Analyst Intern

Joined a small team supporting operations and product with reporting, data cleaning, and keeping KPIs consistent across dashboards.

4 months · 2023
Reporting workflows — less copy-paste, more answers

Several recurring reports were rebuilt by hand in spreadsheets every week, which left little time to discuss what the numbers meant.

Helped set up Power Automate flows and scheduled refreshes so key reports pulled their own data. Worked with my manager to test the new process against the old spreadsheets and fix mismatches before handing it over to the team.

Impact

Freed up time that used to go into updating spreadsheets so the team could spend more of their weekly check-ins talking about trends and next steps.

Power Automate Power BI Excel
Data cleaning & reconciliation — making 50K+ rows usable

Operational data came in with duplicates, inconsistent IDs, and missing values, which made simple questions hard to answer confidently.

Used SQL and Python (Pandas) to clean and reconcile 50K+ records into analysis-ready tables for leadership dashboards and ad-hoc questions. Logged the main assumptions and filters so future queries could follow the same rules.

Impact

Reduced "is this data clean?" conversations in reviews and gave stakeholders a clearer, repeatable base for their own analysis.

SQL Python Pandas
KPI definitions — everyone talking about the same numbers

Different teams reused the same metric names but calculated them slightly differently, which made cross-team dashboards confusing.

Worked with analysts and managers to write down 10+ KPI definitions, including formulas, filters, and caveats. Updated dashboard labels and notes so people could quickly see how a metric was built.

Impact

Made it easier for teams to compare results and reduced time spent in meetings debating definitions instead of outcomes.

Documentation Power BI Tableau

Things I built to learn out loud

Maven Market - Power BI

Maven Market Power BI Dashboard

End to end Power BI solution for a multi national retail chain. Built a star schema from raw CSVs, wrote DAX measures for time intelligence and KPI tracking, and designed an interactive dashboard covering revenue, profit, returns, and regional store performance.

Why it matters

This is how I practice realistic retail reporting: modeling from raw files, writing reusable measures, and designing views that make sense for executives and store managers, not just for a portfolio screenshot.

Power BI DAX Power Query Star Schema
Power BI

Production Grade ETL Pipeline

ETL Pipeline Architecture

Built a bronze to silver to gold ETL pipeline that ingests REST API data into MySQL. Includes hash based change detection, a simple data quality framework with logged checks, and advanced SQL analytics using CTEs, window functions, HHI, and Shannon entropy.

Why it matters

This is where I practice analytics engineering basics: layered data, change detection, quality checks, and analytic queries on top. It shows how I think about moving from one off scripts to something repeatable.

Python MySQL SQLAlchemy Docker
Python

Market Basket Analysis

Market Basket Analysis Heatmap

Analyzed customer purchasing patterns to uncover product associations using Apriori based association rule mining. Used clustering to explore simple customer segments and surfaced practical cross sell and upsell opportunities.

Why it matters

Shows how I move from algorithms to store level actions like shelf placement, bundles, and targeted offers instead of stopping at support and confidence scores.

Python Pandas Apriori Clustering
Jupyter Notebook

Edmonton Property Value Drivers

Edmonton Neighbourhood Appreciation Rates

Statistical analysis of 1.2M property assessment records (2022-2024) from the City of Edmonton Open Data Portal. Used t-tests, ANOVA, and OLS regression to identify what drives assessed values and which neighbourhoods gained or lost value.

Why it matters

Shows how I work with real civic data end to end: cleaning messy records, picking the right statistical test for each question, and turning regression output into findings a non-technical audience can act on.

Python Pandas Statsmodels Scipy
Jupyter Notebook

HR Analytics Dashboard

HR Analytics Dashboard

Interactive Power BI dashboard analyzing employee attrition trends inspired by real IT industry data. Includes KPI cards, attrition breakdowns by age, department, salary, and job role, plus job satisfaction views for retention conversations.

Why it matters

Gives a taste of how I would support HR or people teams: clean breakdowns, simple navigation, and views that help managers talk about risk and retention instead of just counts.

Power BI DAX Power Query Excel
Power BI

MongoDB Query Performance

MongoDB Query Performance Benchmark

Explored data modeling tradeoffs in MongoDB by comparing normalized and embedded document models on a music dataset. Benchmarked songwriter and recording queries to see the real performance impact of schema choices.

Why it matters

This is where I test my understanding of modeling tradeoffs. It shows that I care about how a schema behaves under real workloads, not just how it looks in a diagram.

Python MongoDB Data Modeling Benchmarking
Python

SQL Query Optimization

SQL Query Optimization Results

Benchmarked SQL query execution on e commerce style datasets with different indexing strategies. Used Python scripts to collect execution times and visualize performance improvements to see which indexes actually matter.

Why it matters

Shows that I do not stop at “the query runs”. I care about how fast and how scalable it is, and I am comfortable measuring the impact of indexing and query design decisions.

SQL Python Indexing Performance
Python

What I bring to the table

Languages

Python
SQL
DAX
DAX
R
R

Databases

MySQL
PostgreSQL
MongoDB
Oracle SQL

Libraries

Pandas
NP
NumPy
Matplotlib
Scikit-learn

Dashboards

Power BI
Tableau
X
Excel
Looker

Infrastructure

Docker
MS Fabric
dbt
dbt
ETL Pipelines

So… who’s this guy?

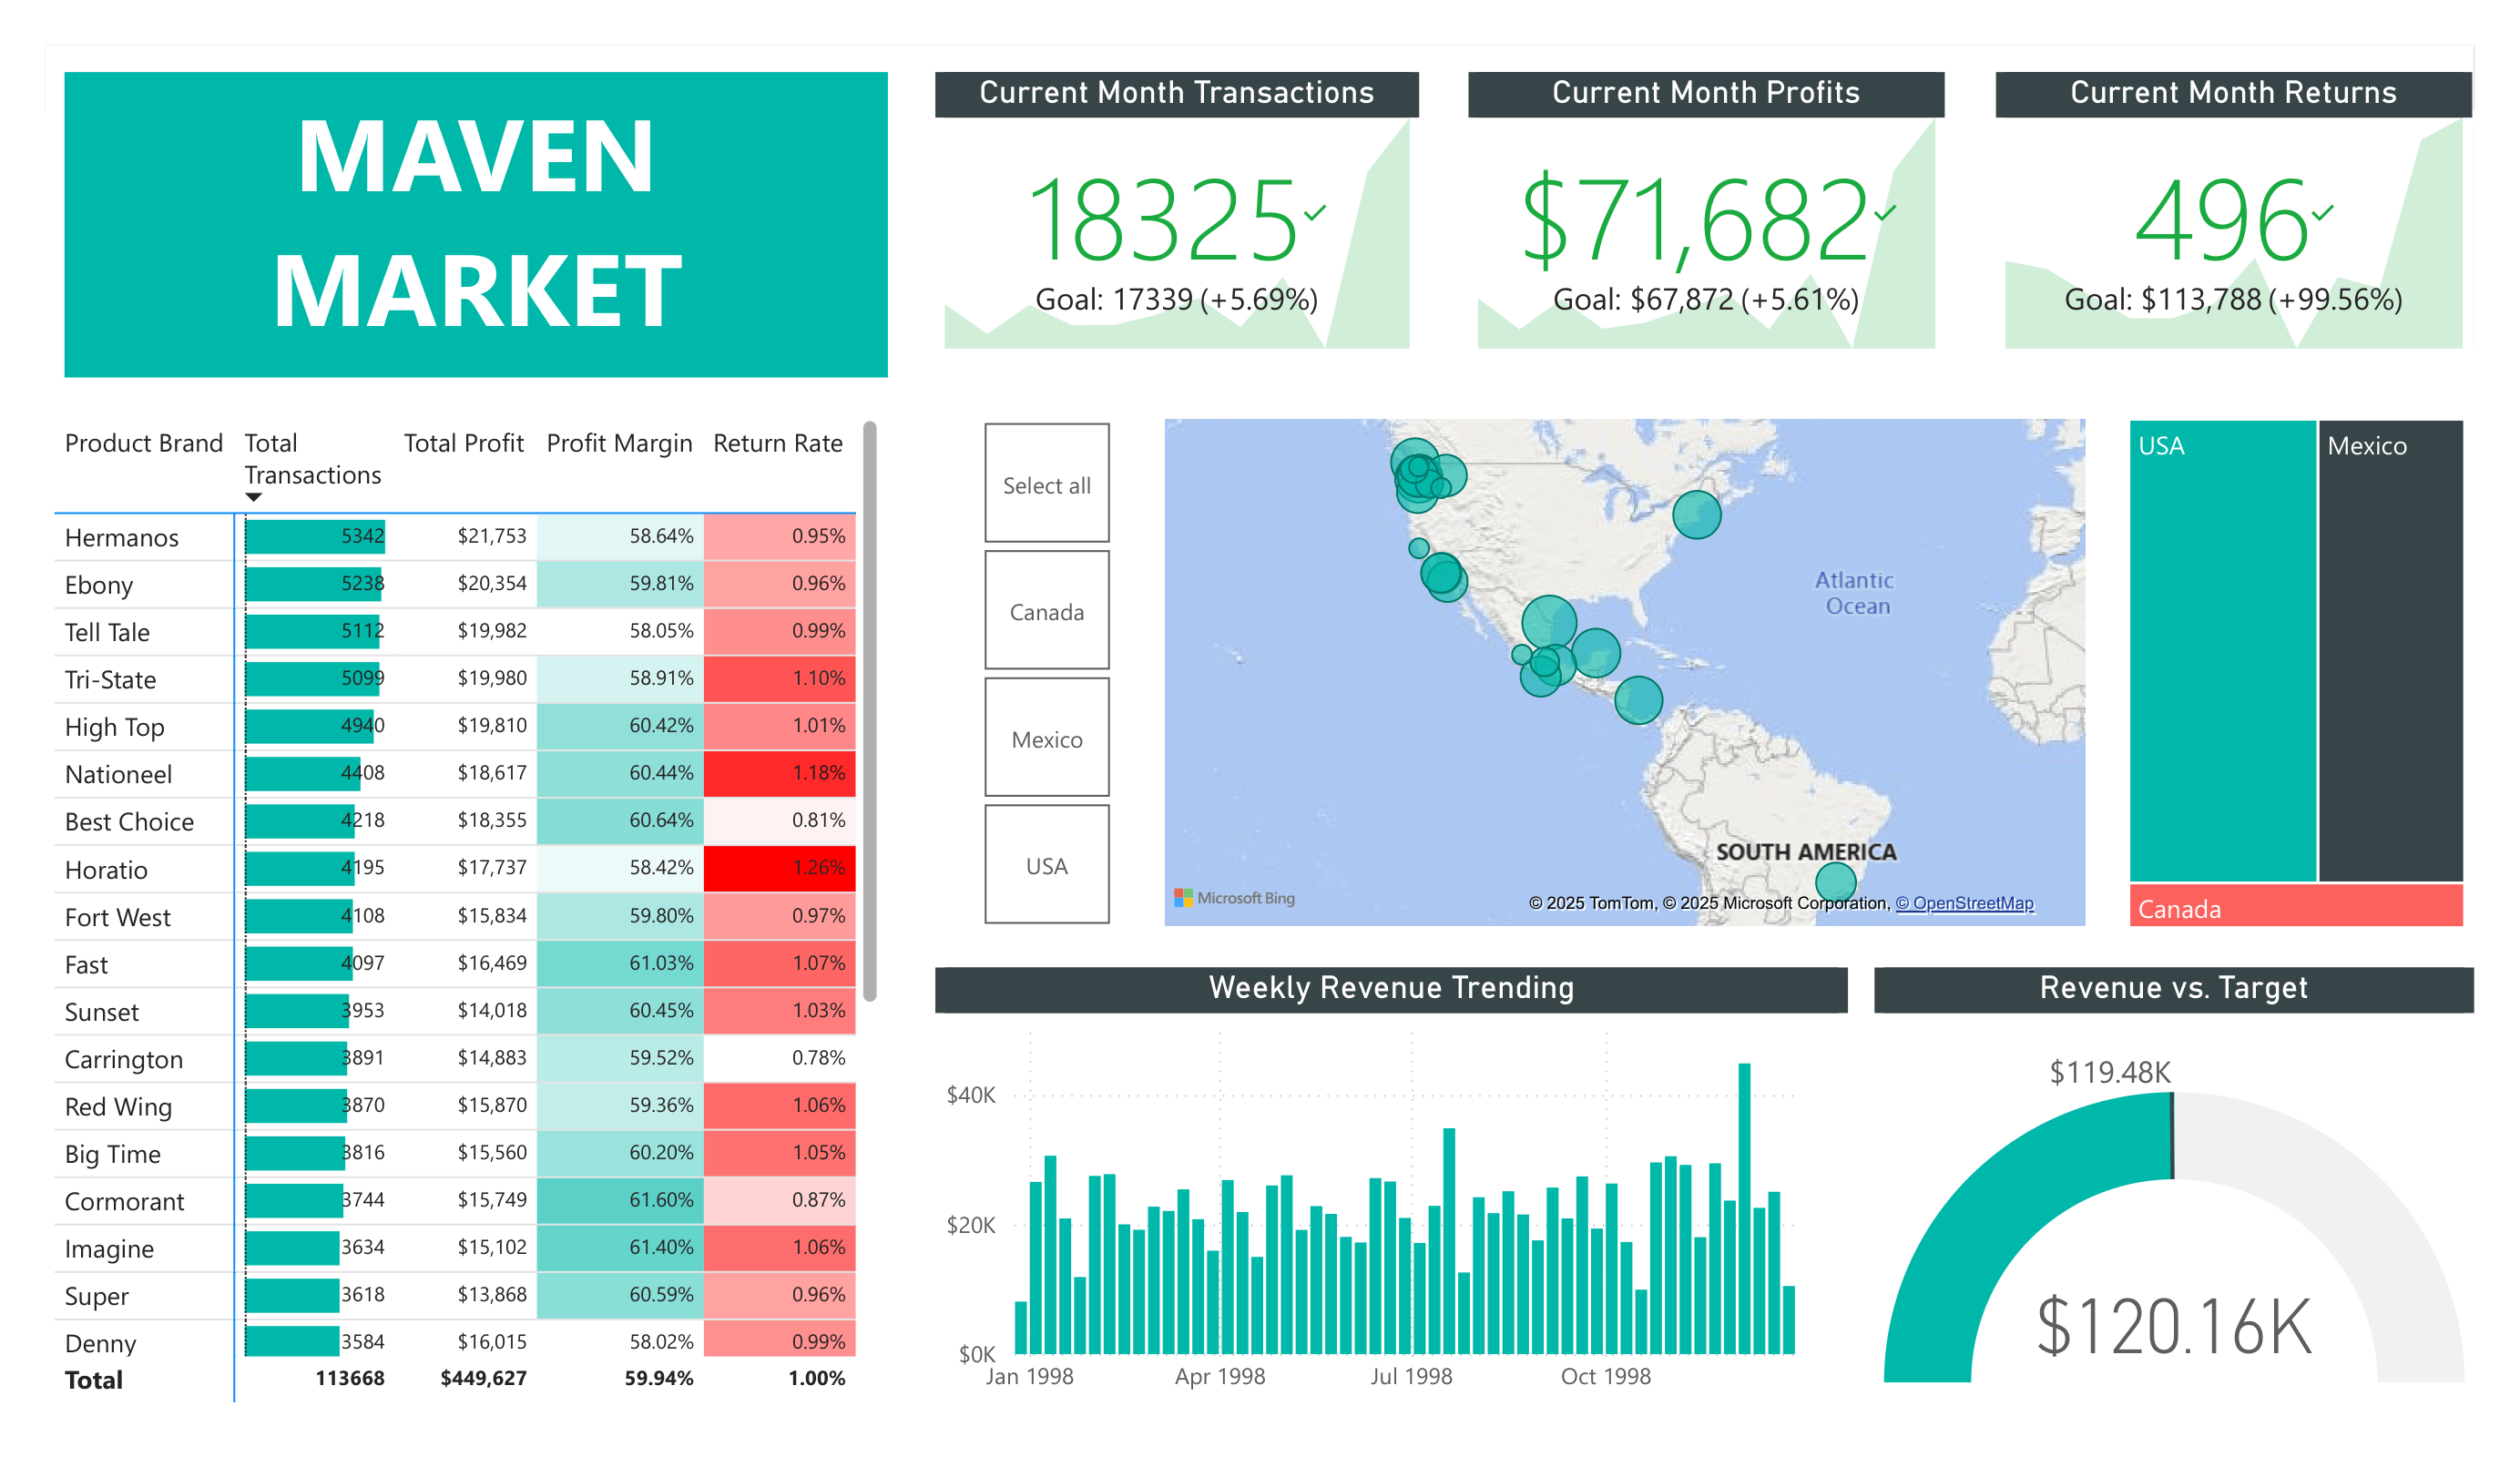
I am a data and reporting analyst with a Computer Science major and Business minor who accidentally fell in love with the messy part in the middle: taking half-broken data and turning it into something leaders can actually use. Writing SQL is fun, but watching a VP say “oh, that actually makes sense now” is way better.

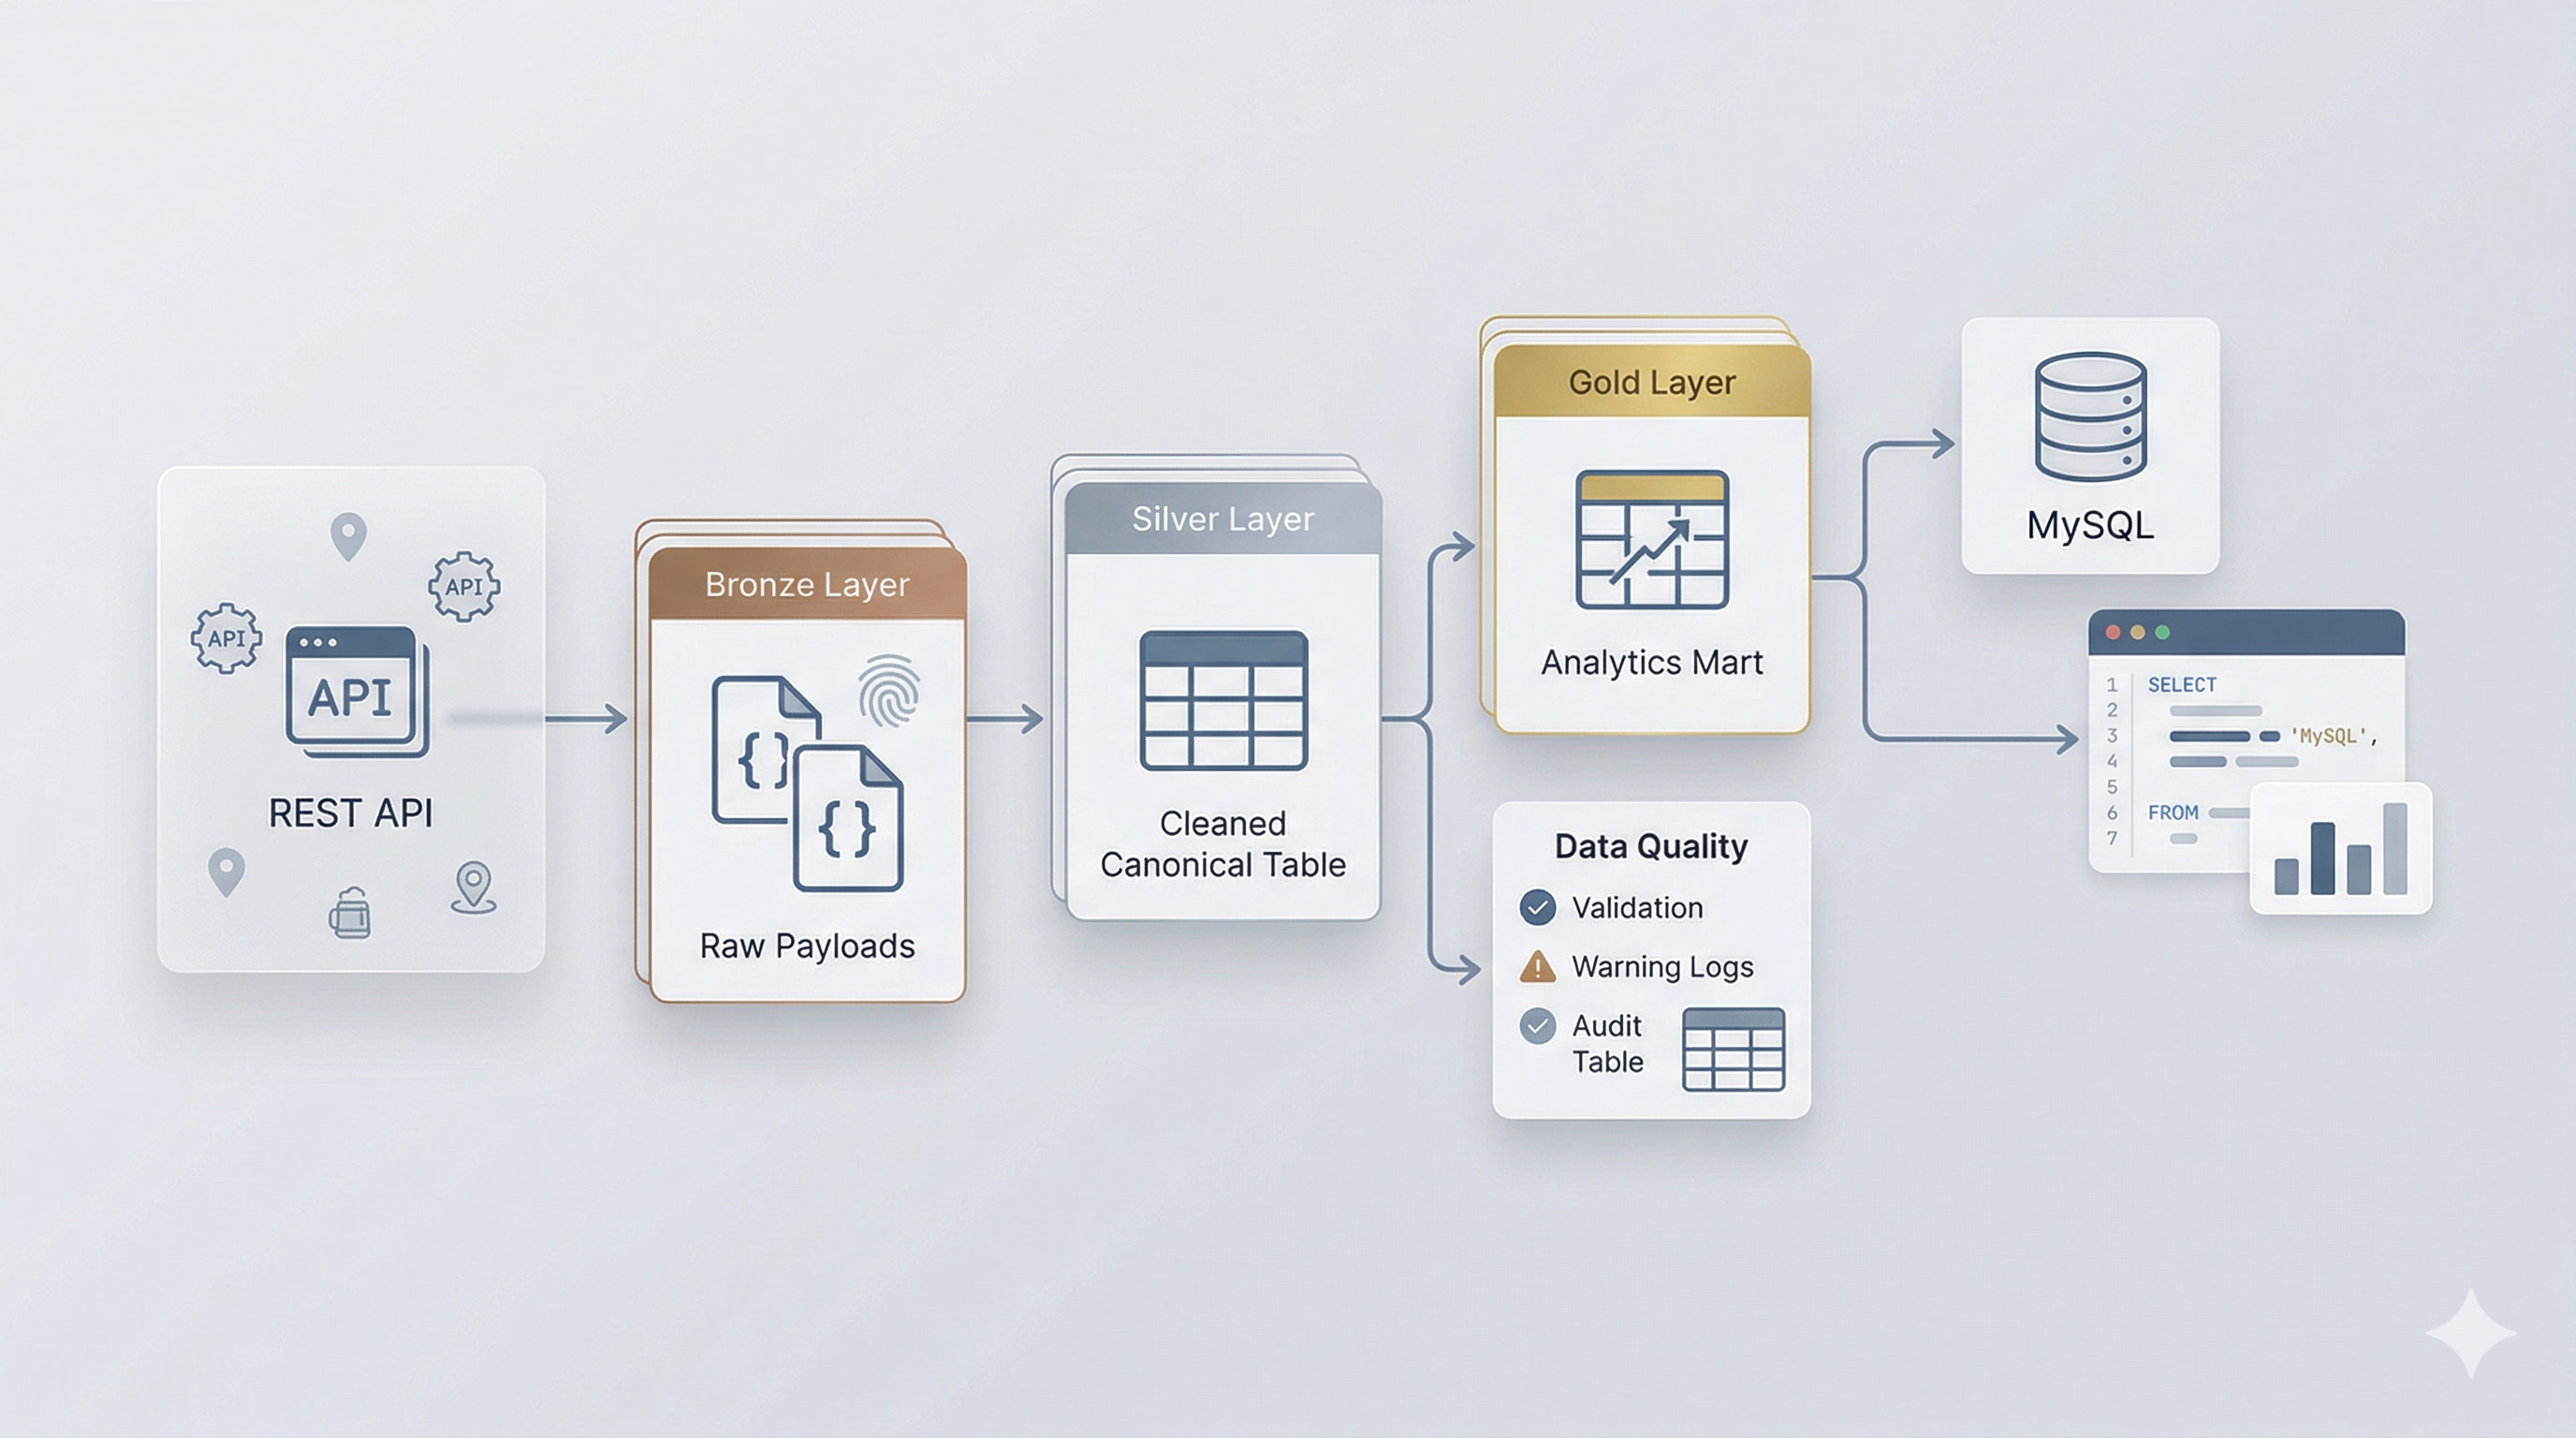
At Alberta Innovates, that meant helping move innovation funding data out of scattered spreadsheets and into Microsoft Fabric and Power BI. Most of my days were spent doing unglamorous things: chasing down what a column really meant, aligning metric definitions, and fixing the kind of edge cases that only show up the night before a review meeting. At Whistling Solutions, it looked like building simple experiment workflows so product changes had numbers behind them instead of “we feel like it’s better.”

I’ve noticed the pattern is almost always the same: unclear definitions, scattered sources, and smart people stuck in meetings debating which number is correct. My small obsession is building a calm, reliable layer between all of that and the people who actually need to decide. I like my data work the way I like my coffee: no drama, no surprises, and strong enough that people trust it.

When I’m not doing that, I read about data engineering practices I’m slowly growing into, tweak my own Power BI designs just to shave off one more click, and work on my French at a pace my friends find very entertaining. Somewhere between all of that, I’m trying to become the kind of analyst teams call when they want fewer dashboards and better decisions.

How I work

  • 01 Decision-first. Every pipeline, model, and dashboard starts with the question: what decision does this enable?
  • 02 Clarity over cleverness. I'd rather build something a PM can explain to their VP than something that impresses other engineers.
  • 03 Reliability is a feature. If the data can't be trusted, the dashboard is decoration. I obsess over data quality.
  • 04 Ship, then iterate. Perfect is the enemy of useful. I deliver early, gather feedback, and improve continuously.

Let's work together

Open to data analyst and analytics engineer roles across Canada. Always happy to chat about data problems.